
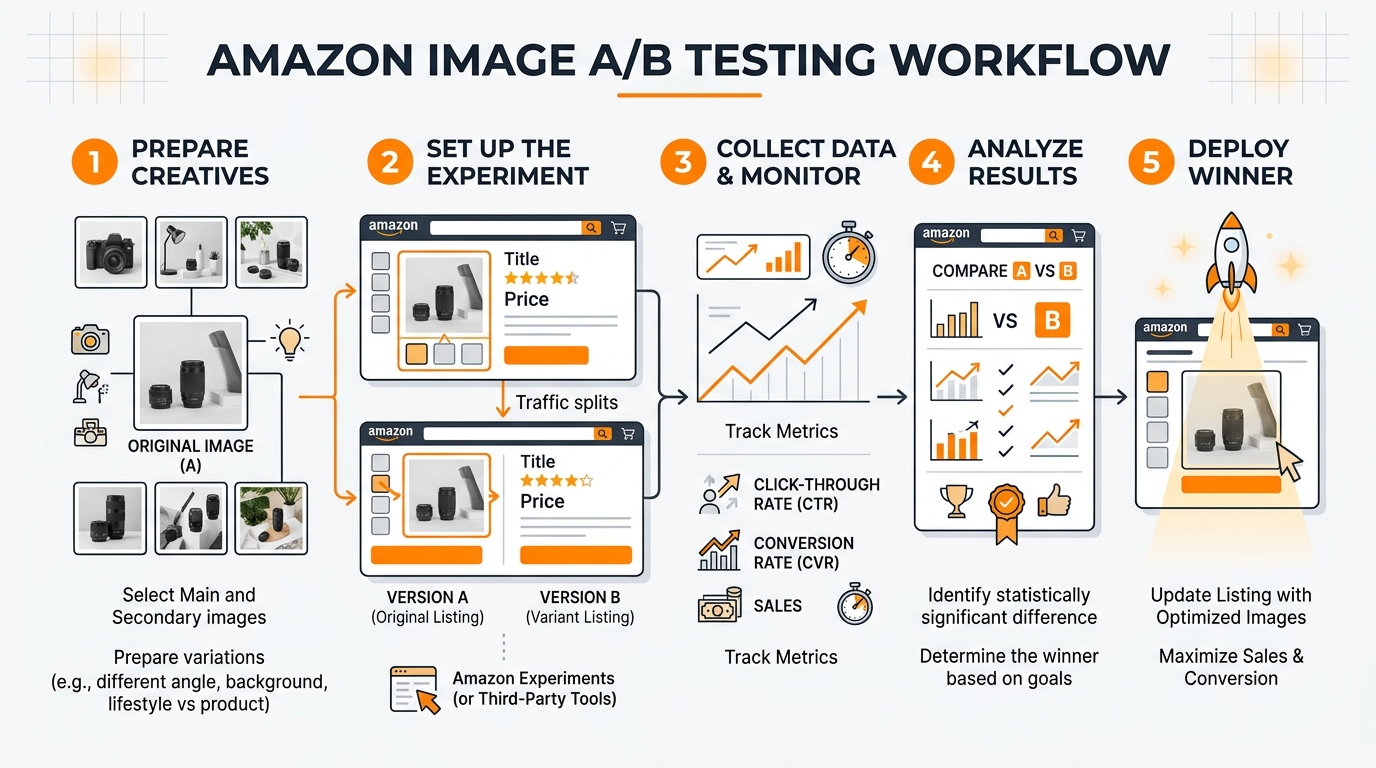
Most Amazon sellers test their images wrong. They change everything at once, ignore statistical significance, and make decisions based on gut feelings rather than data. The result? Wasted ad spend, suppressed listings, and conversion rates that stay flat while competitors eat market share.
Amazon image A/B testing isn’t about uploading random variations and hoping for the best. It’s a systematic process that can increase your click-through rate by 15-40% and boost conversion rates by 8-25%. But only if you do it right.
The math is straightforward. If you’re spending $3,000 monthly on PPC with a 12% conversion rate, improving that to 15% through better images drops your ACoS by 20%. That’s $600 monthly in recovered ad spend. Scale that across multiple ASINs and you’re looking at serious money.
Amazon Listing Image Requirements 2026 covers this in more detail.
Understanding Amazon’s Split Testing Environment
How Amazon’s A10 Algorithm Processes Image Changes
Amazon’s A10 algorithm treats image changes differently than text updates. When you swap a main image, the algorithm doesn’t immediately reset your BSR or tank your organic rankings. But it does monitor performance metrics more closely for the first 72 hours.
Amazon Comparison Image Strategy covers this in more detail.
The algorithm weighs image performance through multiple signals. Click-through rate from search results carries the heaviest weight, followed by time spent on your listing, and conversion rate. Image changes that hurt CTR get algorithmic penalties within days. Improvements take 7-14 days to compound into better organic placement.
Here’s what sellers miss: Amazon doesn’t just track which image performs better. It tracks how quickly performance changes after the swap. Sudden drops in engagement signal low-quality updates. Gradual improvements signal algorithmic confidence. This is why testing timeframes matter more than most sellers realize.
Amazon Main Image Best Practices 2 covers this in more detail.
Built-in Testing Tools vs. Third-Party Solutions
Amazon’s native Manage Your Experiments tool handles basic main image tests for Brand Registry sellers. It splits traffic automatically and provides statistical significance calculations. But it’s limited to main images only and requires minimum traffic thresholds most sellers can’t hit.
How Many Images For Amazon Listing covers this in more detail.
Third-party tools like PickFu, SplitBase, and Listing Dojo offer more flexibility. They can test lifestyle images, infographics, and comparison charts that Amazon’s tool can’t handle. The downside? They rely on external traffic or survey data that doesn’t always match your actual customer behavior.
The hybrid approach works best. Use Amazon’s native tool for main image tests on high-traffic ASINs. Use third-party validation for secondary images and new product launches where you can’t afford to guess wrong.
Traffic Requirements for Valid Test Results
Statistical significance requires minimum sample sizes most sellers underestimate. For a main image test to detect a 10% CTR improvement, you need roughly 2,000 impressions per variation. That means 4,000 total impressions minimum.
Most ASINs generating under 100 daily sessions can’t run meaningful split tests using organic traffic alone. You’ll need to drive additional traffic through PPC to reach significance thresholds. Budget an extra 30-50% of your normal ad spend during testing periods.
Low-traffic products need different approaches. Instead of live split testing, use tools like first-click testing or preference surveys to validate concepts before committing to changes.
Pre-Test Planning and Hypothesis Development
Analyzing Current Image Performance Metrics
Before testing anything, audit your existing image performance through Brand Analytics and advertising reports. Look for patterns in your current metrics that suggest optimization opportunities.
Start with your main image CTR in search results. Access this through the Search Query Performance report in Brand Analytics. CTRs below 0.8% for competitive keywords indicate main image problems. CTRs above 1.5% suggest your main image works but other factors might be limiting conversions.
Next, examine your listing conversion rate by traffic source. Organic traffic that converts 5%+ but PPC traffic converting under 3% often indicates a main image that attracts the wrong clicks. Your image promises something your product doesn’t deliver.
Analyze your image engagement through the Detail Page Sales and Traffic report. Time spent viewing images correlates with conversion likelihood. Products with image engagement under 15 seconds typically have unclear value propositions or poor image hierarchy.
Identifying High-Impact Test Opportunities
Not all image slots deliver equal impact. Main images drive 60-80% of your CTR from search results. Secondary images 2 and 3 handle most conversion convincing. Images 5-7 typically see minimal engagement unless customers are highly motivated.
Focus testing efforts on these high-impact scenarios:
- Main images with CTR under 1.0% – Usually indicate visibility problems or weak differentiation
- Lifestyle images with low engagement – Often too generic or don’t show clear usage context
- Comparison charts that don’t convert browsers – May highlight wrong differentiators or use confusing layouts
- Size/scale images for dimensional products – Critical for furniture, supplements, and electronics where size expectations matter
Prioritize tests based on traffic volume and current performance gaps. A 20% improvement on your main image beats a 50% improvement on image slot 6.
Setting Clear Success Metrics and Thresholds
Define success metrics before you start testing. Most sellers track too many vanity metrics and ignore the numbers that actually impact profitability.
Primary metrics should tie directly to revenue:
- Click-through rate from search results (main image tests only)
- Listing conversion rate (all image tests)
- Revenue per visitor (accounts for both CTR and CVR changes)
- ACoS impact for PPC-driven traffic
Set minimum improvement thresholds worth implementing. A 5% CTR boost sounds good but may not justify the effort if your current CTR is already strong. Aim for improvements that move your key metrics by at least 10% to account for seasonal fluctuations and testing noise.
Establish statistical confidence requirements upfront. 95% confidence is standard, but 90% confidence might be acceptable for low-risk image swaps. Never make decisions based on results under 85% confidence.
Setting Up Your Testing Infrastructure
Tool Selection and Account Configuration
Choose your testing approach based on traffic volume and technical comfort level. Amazon’s native testing through Manage Your Experiments works best for established sellers with consistent daily traffic above 100 sessions.
To access Amazon’s split testing tool, you need Brand Registry and must be selling in categories that support image experiments. Navigate to Advertising Console, select Stores and manage your experiments. The setup requires selecting your primary success metric upfront – choose conversion rate for most tests.
For sellers who can’t use Amazon’s native tool, PickFu offers the best external validation for main images. Create tests with 50-100 respondents from Amazon’s actual customer demographic. Budget $50-200 per test depending on targeting specificity.
SplitBase and Listing Dojo work better for ongoing testing programs across multiple ASINs. They integrate with your existing analytics and can track longer-term performance trends that Amazon’s 8-week testing windows miss.
Image Asset Preparation and Organization
Prepare your test images according to Amazon’s current listing image requirements before launching tests. All variations must meet technical specifications: 1600×1600 minimum pixels, RGB color mode, and under 5MB file size.
Create systematic file naming conventions that prevent mix-ups during upload. Use formats like: ProductName_MainImage_V1_Test.jpg and ProductName_MainImage_V2_Control.jpg. Include creation dates and brief descriptors that remind you what each variation tests.
Build image sets that test single variables whenever possible. If you’re testing background color, keep product angle, lighting, and props identical. Multi-variable changes make it impossible to determine which element drove performance differences.
Store original high-resolution files separately from your compressed upload versions. You’ll need to create additional variations if initial tests show promising directions. Having source files prevents quality degradation from multiple rounds of editing.
Conversion Tracking Setup
Configure conversion tracking before launching tests so you don’t lose early performance data. This means setting up proper attribution windows and ensuring your analytics can separate test traffic from regular performance.
For Amazon’s native testing tool, conversion tracking happens automatically. But verify that your Brand Analytics access is working and that you understand how to pull experiment-specific performance data from the advertising console.
Third-party tools require more manual setup. Create unique UTM parameters for any external traffic you’re driving to test variations. Set up custom segments in Google Analytics if you’re using external landing pages to pre-qualify traffic before sending to Amazon.
Document your baseline metrics during the week before testing begins. You’ll need these numbers to calculate lift accurately and to spot external factors that might skew results. Screenshot your current CTR, CVR, and ACoS numbers from the exact same reporting timeframe you’ll use for test analysis.
Executing Tests for Maximum Data Quality
Proper Test Duration and Sample Sizes
Most Amazon sellers end their tests too early, making decisions on insufficient data that leads to false positives. Amazon image A/B testing requires patience and statistical discipline to generate reliable insights.
Plan for minimum 14-day test durations, regardless of early results. Amazon’s customer behavior includes weekend shoppers, mobile vs desktop preferences, and different purchase timing patterns throughout the week. Seven-day tests miss these variations and skew conclusions.
Calculate required sample sizes before testing begins. For main image CTR tests, you need approximately 1,000 clicks per variation to detect meaningful differences. Conversion rate tests require 300-500 conversions per variation for statistical significance. Lower-traffic ASINs should drive additional PPC traffic to reach these thresholds within reasonable timeframes.
High-traffic products can reach significance faster, but resist the temptation to call tests early even when results look obvious. Statistical significance at day 3 often disappears by day 10 as different customer segments engage with your listing.
Controlling for External Variables
Amazon’s marketplace includes dozens of variables that can contaminate test results if you don’t account for them properly. Seasonal shopping patterns, competitor price changes, and even weather can impact image performance in ways that have nothing to do with your actual creative.
Avoid testing during high-volatility periods like Prime Day, Black Friday, or major sporting events unless those periods represent your normal selling environment. The customer mindset during promotional events doesn’t match typical browsing and buying behavior.
Monitor competitor activity during your test period. If a major competitor launches aggressive PPC campaigns or changes their pricing significantly, document these events and extend your testing window to account for the temporary market disruption.
Track your organic ranking positions daily during tests. Ranking fluctuations change the type of customer who sees your main image, which can make a winning variation look like a loser simply because it appeals to different search intent levels.
Data Collection and Quality Assurance
Set up systematic data collection processes that capture performance metrics at consistent intervals. Daily snapshots prevent gaps that could mask important trends or inflection points in your test results.
Use Amazon’s Business Reports and Brand Analytics as your primary data sources for internal tests. Export data at the same time each day to avoid timezone inconsistencies. Morning exports typically capture complete previous-day performance without partial-day distortions.
Cross-reference your performance data with external factors that might influence results. Check for inventory stockouts, listing suppression warnings, or account health notifications that could impact test validity. A suppressed listing during days 5-8 of your test makes the entire dataset unreliable.
Document any anomalies immediately rather than trying to remember them during analysis. Unusual spikes in traffic, sudden drops in conversion rates, or notification from Amazon about image policy reviews should all be timestamped and noted for context during results interpretation.
Analyzing Results and Making Data-Driven Decisions
Statistical Significance vs. Practical Significance
Achieving statistical significance doesn’t automatically mean your test results matter for business outcomes. A main image that increases CTR by 3% with 95% confidence might be statistically valid but practically meaningless if your current CTR is already strong and the improvement doesn’t impact revenue.
Focus on practical significance thresholds that justify implementation effort. For main images, improvements under 10% rarely move the needle on overall business performance. For conversion rate tests, changes under 15% often get lost in normal marketplace volatility.
Calculate the revenue impact of observed changes before making swap decisions. A 12% CVR improvement sounds impressive, but if it only adds $200 monthly revenue while requiring ongoing image production costs, the ROI doesn’t support implementation.
Consider confidence intervals, not just point estimates. A test showing 18% conversion improvement with a confidence interval from 8% to 28% suggests high uncertainty. The true improvement might be much smaller than the headline number indicates.
Understanding Segment-Specific Performance
Different customer segments respond differently to image variations, and Amazon’s traffic includes multiple distinct behavioral groups that require separate analysis approaches.
Analyze performance by traffic source when possible. Organic search traffic often responds differently to main images than PPC traffic because the customer intent and price sensitivity differs. An image that improves organic CTR might hurt PPC conversion if it attracts more price-sensitive browsers.
Mobile vs desktop performance can vary significantly for image-heavy products. Mobile shoppers scroll through images faster and focus on different visual elements than desktop users who spend more time examining details. Winning images should perform well across both platforms.
Consider repeat customer behavior separately from new customer acquisition. Existing customers already understand your brand positioning and might respond better to product-focused images, while new customers need more context and lifestyle positioning to understand value propositions.
Track performance by keyword category when traffic data allows. Branded keyword traffic behaves differently than generic category searches. Your main image optimization might work perfectly for branded traffic but confuse customers discovering you through category browsing.
ROI Calculation and Implementation Decisions
Convert test results into clear ROI projections that account for both immediate performance gains and longer-term algorithmic benefits. Most sellers focus only on short-term conversion improvements and miss the compounding effects of better click-through rates on organic ranking.
Calculate monthly revenue impact using conservative estimates from your confidence intervals. If your test shows 15% conversion improvement with a 95% confidence interval from 10% to 20%, use the 10% figure for projections. This prevents over-optimistic decisions based on best-case scenarios.
Factor in implementation costs beyond just image production. Better images often enable higher PPC bids due to improved Quality Scores, but they might also increase customer acquisition costs if they attract more competitive segments. Model these secondary effects before committing to changes.
Consider the compound effects of image improvements on Amazon’s algorithm. Better CTR leads to improved organic rankings, which drives more traffic at lower costs. A main image that increases CTR by 15% might improve your organic position enough to reduce PPC dependency by 20-30% over 3-6 months.
Advanced Testing Strategies and Optimization
Sequential Testing for Continuous Improvement
Most sellers treat Amazon image A/B testing as one-time projects rather than ongoing optimization systems. Sequential testing approaches compound improvements over time and prevent competitors from copying your advances before you’ve maximized their value.
Plan 3-4 rounds of iterative testing based on initial results. If your first main image test improves CTR by 12%, the next test should build on that winner rather than starting from scratch. Test variations of angles, props, or background elements that enhance the winning concept further.
Use insights from secondary image tests to inform main image development. If your lifestyle images show that customers respond strongly to specific use cases or demographic representations, incorporate those elements into main image variations for future tests.
Document performance patterns across multiple tests to identify brand-specific customer preferences. Some audiences prefer clean, minimalist presentations while others respond to busy, feature-rich images. Understanding your customer’s visual preferences accelerates future test development.
Build testing calendars that align with your product development and seasonal cycles. New product launches need different image strategies than mature products defending market share. Plan your testing sequence to support broader business objectives.
Multi-Variate Image Testing
Advanced sellers can test multiple image elements simultaneously using factorial design approaches. This requires higher traffic volumes but generates insights about how different image components interact with each other.
Test combinations of background colors, product angles, and prop selections systematically. A 2x2x2 factorial design creates eight distinct image variations but reveals which combinations work best together rather than just individual element performance.
Lifestyle image testing benefits particularly from multi-variate approaches. Customer demographics, usage contexts, and product presentations all interact in ways that single-variable tests miss. Understanding these interactions enables more sophisticated image strategies.
Use multi-variate testing for comparison chart optimization where multiple information hierarchy decisions compound into overall effectiveness. Testing headline priority, feature selection, and visual layout simultaneously reveals optimal combinations faster than sequential single-variable tests.
Cross-ASIN Testing Insights
Develop image performance principles that scale across your product catalog by testing similar strategies on multiple ASINs simultaneously. This approach reveals brand-level customer preferences that individual product tests might miss.
Test consistent image themes across product lines to identify visual branding elements that improve performance universally. Background colors, lighting styles, and compositional approaches that work for one product often benefit related items in your catalog.
Use learning from high-traffic ASINs to optimize lower-traffic products without running individual tests. If your bestselling kitchen gadget responds well to bright, clean backgrounds, apply similar approaches to related products and monitor performance improvements.
Build image template systems based on cross-ASIN testing results. Standardized approaches for different product categories reduce production costs while maintaining performance optimization based on proven customer preferences.
The key to successful Amazon comparison image strategy often emerges from cross-product testing that reveals how customers evaluate different features and benefits across your entire range.
Scaling Your Image Testing Program
Building Systematic Testing Workflows
Successful image optimization requires systematic approaches that scale beyond individual product tests. Build workflows that handle multiple concurrent tests while maintaining data quality and preventing resource conflicts.
Create testing calendars that sequence experiments to avoid interference between related ASINs. Testing main images for competing products simultaneously can create internal competition that skews results. Space related tests at least two weeks apart.
Develop image production pipelines that support rapid iteration based on test results. This means maintaining relationships with photographers who understand your testing needs and can quickly produce variations of winning concepts.
Standard operating procedures should cover test setup, data collection, analysis methods, and implementation decisions. Document these processes so team members can execute tests consistently without requiring specialized expertise for every experiment.
Build feedback loops between your testing program and broader product development. Insights about customer visual preferences should inform new product photography from launch rather than requiring optimization after poor initial performance.
Resource Allocation and Budget Planning
Image testing requires ongoing investment in both traffic generation and creative production. Budget 15-25% of your advertising spend for testing activities, including additional PPC to drive traffic volume for statistical significance.
Prioritize testing budgets based on potential impact rather than spreading resources equally across all products. High-traffic ASINs with poor current performance offer the highest ROI for testing investment. Low-traffic products might benefit more from applying proven insights from similar items.
Factor testing costs into your product launch budgets. New products need image optimization from day one rather than waiting for organic performance data that might take months to accumulate. Budget for 2-3 rounds of testing during the first 90 days post-launch.
Consider the lifetime value of image improvements when allocating testing resources. Better images improve organic rankings and reduce long-term PPC costs, making the ROI calculation more favorable than short-term conversion improvements alone suggest.
Team Training and Knowledge Management
Scale image testing capabilities across your organization by developing internal expertise rather than relying on external consultants for every experiment. This requires systematic training and knowledge management systems.
Train team members on statistical significance concepts so they can interpret results correctly and avoid common mistakes like ending tests early or making decisions on insufficient data. Basic statistical literacy prevents costly optimization errors.
Document case studies from successful tests including the specific insights that drove improvements. This knowledge base accelerates future test development and helps new team members understand customer behavior patterns specific to your products and market.
Establish clear decision-making authority for test implementation. Delays between achieving statistical significance and implementing changes reduce the competitive advantage from testing programs. Designate who can approve image swaps based on predetermined performance criteria.
When implementing insights from your testing program, remember that following Amazon main image best practices provides the foundation, but customer-specific testing reveals the optimizations that create lasting competitive advantages.
Frequently Asked Questions
How long should I run Amazon image A/B tests to get reliable results?
Run tests for minimum 14 days regardless of early results to account for weekly shopping patterns and different customer segments. You need at least 1,000 clicks per variation for main image tests and 300-500 conversions per variation for listing conversion tests. High-traffic products might reach significance faster, but don’t end tests before the 14-day minimum to avoid false positives from incomplete data cycles.
Can I test secondary images without Amazon’s native split testing tool?
Yes, but you’ll need external validation methods since Amazon’s Manage Your Experiments tool only handles main images. Use tools like PickFu for customer preference surveys or create manual tests by swapping images and monitoring performance changes over 2-3 week periods. Track conversion rates and image engagement metrics through Business Reports to measure impact. Just ensure you’re not making multiple changes simultaneously that could confuse attribution.
What’s the minimum traffic needed to run meaningful image tests?
You need roughly 100+ daily sessions to gather sufficient data within reasonable timeframes. Products with lower organic traffic should drive additional PPC traffic during testing periods, budgeting 30-50% extra ad spend. Alternative approaches for low-traffic products include using customer surveys, analyzing high-traffic competitor strategies, or applying insights from similar products in your catalog that have sufficient traffic for proper testing.
How do I know if my test results are practically significant, not just statistically significant?
Calculate the actual revenue impact using conservative estimates from your confidence intervals. Improvements under 10% for CTR or 15% for conversion rates often don’t justify implementation costs or provide meaningful business impact. Consider the monthly revenue increase, implementation costs, and long-term algorithmic benefits. A statistically significant 5% improvement that adds only $100 monthly revenue probably isn’t worth pursuing compared to testing higher-impact opportunities.
Should I test multiple image slots simultaneously or focus on one at a time?
Focus on one image slot at a time to clearly attribute performance changes to specific modifications. Start with main images since they drive 60-80% of your click-through rate from search results. After optimizing your main image, move to lifestyle images in slots 2-3 which handle most conversion convincing. Testing multiple slots simultaneously makes it impossible to determine which changes drove performance improvements and wastes testing resources on potentially conflicting optimizations.