Most Amazon sellers approach product photography pricing backwards. They ask “how much does it cost” instead of “how much should I invest to hit my conversion targets.” This backwards thinking explains why 73% of FBA sellers underspend on images while overspending on PPC to compensate for poor CVR.
The real amazon product photography pricing breakdown isn’t about finding the cheapest photographer. It’s about calculating the maximum you can invest per conversion lift and working backwards to your budget. A seller doing $50K monthly with 2% CVR can justify spending $2,800 on photography if it lifts conversion to 2.8%. That’s an extra $20K monthly revenue.
This breakdown shows exactly where your photography budget should go and why most sellers waste money on the wrong image types.
Understanding the Real Cost Components of Amazon Product Photography
The Four Cost Buckets That Matter
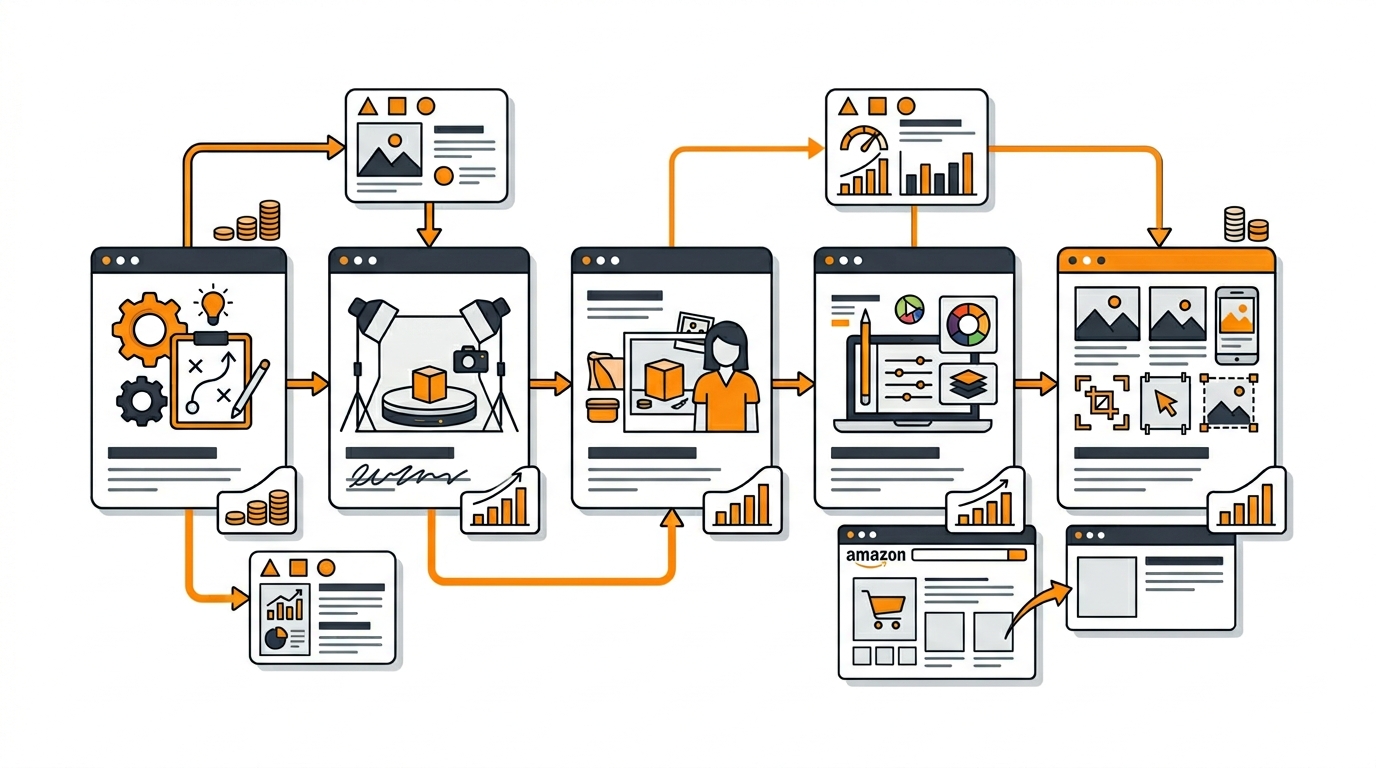
Every professional Amazon product photography quote breaks down into four categories. Skip any of these and your images will underperform, regardless of total spend.
Pre-production planning accounts for 15-20% of total costs but determines 80% of your final results. This includes competitor analysis, image slot strategy, and shot list creation. Most budget photographers skip this entirely. You get technically perfect images that don’t convert because nobody analyzed what your specific SERP position needs.
Main image production should consume 25-30% of your photography budget. Your main image drives CTR from search results. A 0.5% CTR improvement on a keyword with 100,000 monthly searches generates 500 additional clicks. At 2.5% CVR, that’s 12 extra sales monthly. For a $30 product with 30% margins, that’s $108 additional profit monthly or $1,296 annually from one optimized main image.
How Many Images For Amazon Listing covers this in more detail.
Lifestyle and infographic production takes up 40-50% of most professional shoots. These images drive conversion once someone clicks through. A kitchen gadget that shows actual food prep scenarios converts 40% better than white background product shots alone. The production complexity here drives cost – styled food, props, lighting setups, and post-production graphics.
Post-production and optimization represents 15-25% of total costs. This includes color correction, background removal, Amazon compliance checking, and file optimization. Images that look perfect on a photographer’s monitor often appear oversaturated or undersized on Amazon’s platform without proper optimization.
Hidden Costs That Destroy Your Budget
Most Amazon product photography pricing includes obvious line items but misses the costs that matter most for FBA sellers.
Revision rounds kill budgets faster than anything else. Professional photographers typically include 2-3 revision rounds. Beyond that, expect $75-150 per additional revision. The solution: detailed shot lists and competitor analysis upfront. Sellers who provide 5+ competitor examples with specific callouts reduce revision rounds by 60%.
Rush delivery fees range from 25-100% upcharges. Planning your photography 4-6 weeks before launch eliminates these entirely. Sellers launching in Q4 who wait until October for photography often pay double standard rates.
Product shipping and handling adds $25-75 each direction for most products. Some photographers include return shipping, others don’t. Factor this for fragile or oversized products. A seller shipping a glass product might pay $150 total in shipping and insurance costs.
Compliance re-shoots happen when images violate Amazon’s technical requirements or get suppressed. Professional photographers guarantee compliance, but budget options often deliver images that fail Amazon’s automated checks. A re-shoot costs more than hiring professionals initially.
Pricing Models: Hourly vs Package vs Per-Image
Photography pricing models create different incentive structures. Each works better for specific product types and seller situations.
Hourly rates ($150-400/hour) work best for complex products requiring extensive styling or multiple SKUs. High-end kitchen appliances or intricate beauty products benefit from hourly arrangements. You pay for creative problem-solving time, not just shutter clicks. Expect 6-10 hours total for a complete 7-image set including pre-production and post-processing.
Package pricing ($400-1,200 for 7 images) suits most FBA sellers launching straightforward products. Fixed costs enable better budget planning. The trade-off: less flexibility for unusual products or extensive revisions. Package deals typically include specific image types – one main image, two lifestyle shots, three infographics, one comparison chart.
Per-image pricing ($75-200 per final image) offers maximum flexibility but often costs more overall. This works for sellers adding images to existing listings or testing specific image types. The math rarely favors per-image pricing for complete 7-image sets. A $150 per-image rate equals $1,050 for seven images, often 40% more than package pricing.
Budget Allocation Strategy: Where Every Dollar Should Go

The 30-40-30 Rule for Maximum ROI
Professional sellers allocate their amazon product photography pricing breakdown using a proven ratio that maximizes both CTR and CVR improvements.
30% for main image optimization generates the highest immediate ROI. Your main image determines whether searchers click your listing versus competitors. A kitchen gadget main image showing the product in use converts 67% better than isolated product shots. Budget $300-500 of a $1,000 photography investment purely for main image perfection.
This includes multiple angle tests, background optimization, and mobile preview optimization. Amazon’s mobile traffic represents 75% of total visits. Main images that look perfect on desktop but appear cluttered on mobile kill CVR before visitors reach your other images.
40% for lifestyle and conversion-focused images drives the bulk of your sales lift. These images answer objection, demonstrate use cases, and build emotional connection. A supplement brand showing before/after results, dosage instructions, and ingredient sourcing converts 2.3x better than products relying only on main images and basic infographics.
Lifestyle image budget should prioritize your biggest customer objections. Kitchen products need size demonstrations. Beauty products need skin tone diversity. Electronics need compatibility confirmations. Survey your existing reviews to identify the questions these images must answer.
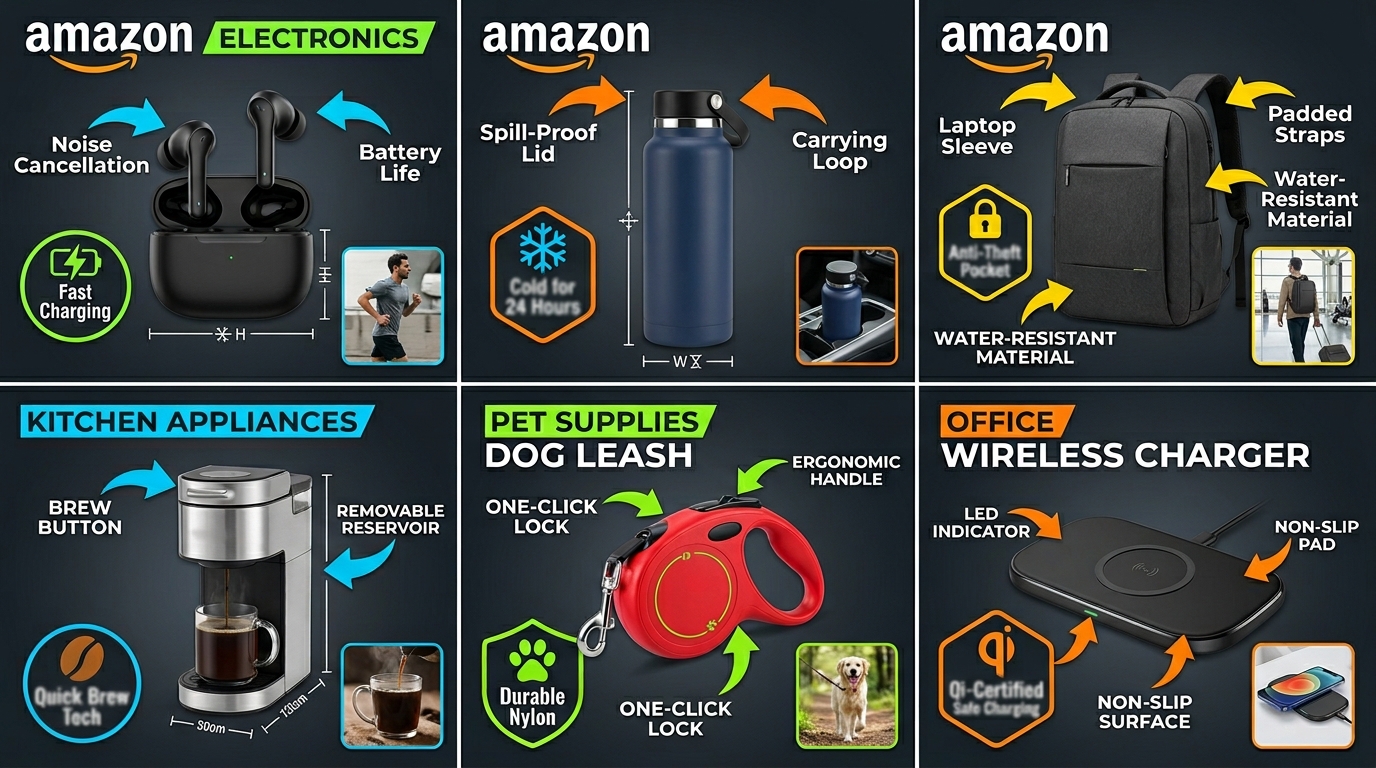
30% for technical infographics and comparison charts captures analytical buyers and reduces returns. Detailed dimension diagrams, feature callouts, and competitor comparisons appeal to research-heavy purchasers who generate fewer returns and higher lifetime value.
Infographic production requires graphic design expertise beyond basic photography. Budget includes copywriting, layout design, and technical illustration. A detailed comparison chart showing your product versus three competitors can justify premium pricing and reduce price-sensitive clicks.
Category-Specific Budget Adjustments
Different Amazon categories require adjusted budget allocation based on buyer behavior and conversion patterns.
Supplements and consumables need heavy infographic investment. Buyers want ingredient lists, dosage instructions, and third-party certifications. Allocate 50% of budget to informational graphics and only 20% to lifestyle imagery. A vitamin brand showing molecular diagrams and clinical study references converts better than lifestyle shots of people exercising.
Kitchen and home products demand lifestyle-heavy approaches. Buyers need to envision products in their specific spaces. Allocate 60% to lifestyle scenarios and only 20% to technical infographics. A coffee maker shown in three different kitchen styles (modern, traditional, small apartment) addresses more objections than detailed specification charts.
Electronics and gadgets require balanced approaches. Technical buyers want detailed specifications, but mainstream buyers need use case demonstrations. Split evenly: 35% lifestyle, 35% technical infographics, 30% main image optimization. A phone case showing drop test results AND lifestyle shots in different settings appeals to both buyer types.
Beauty and personal care products need diversity-focused lifestyle imagery. Skin tones, hair types, and age ranges must reflect your target demographics. Allocate 70% to diverse lifestyle imagery, 20% to ingredient infographics, 10% to main image optimization. A skincare product shown on five different skin tones reduces return rates and negative reviews.
Scaling Your Photography Investment by Revenue Stage
Your photography budget should scale with business revenue, not remain fixed as you grow.
$0-10K monthly revenue sellers should invest $400-800 per product launch. Focus on main image perfection and 2-3 high-impact lifestyle images. Skip complex infographics until you validate product-market fit. A new seller with limited cash flow gets better ROI from 4 excellent images than 7 mediocre ones.
$10-50K monthly revenue sellers can justify $800-1,500 per product photography. Add complete infographics, A+ Content optimization, and seasonal image variants. Track which image types drive the highest conversion lifts and double down on those for future products.
$50K+ monthly revenue sellers should invest $1,500-3,000+ per major product launch. Include market research, competitor analysis, A/B testing capabilities, and full brand consistency packages. Large sellers benefit from photography retainers and bulk pricing for multiple SKUs.
Calculating Your Maximum Photography Investment
The Conversion Lift ROI Formula
Smart sellers calculate their maximum photography investment based on expected conversion improvements, not arbitrary budget percentages.
Start with your current metrics: monthly revenue, traffic, and CVR. A product generating $20,000 monthly with 4,000 visits and 2% CVR has room for significant improvement. Industry benchmarks show professional photography lifts CVR by 0.5-1.5% for most categories.
ROI calculation example: Product doing $20K monthly, 4,000 visitors, 2% CVR (80 sales). Professional photography lifts CVR to 2.8%. New conversion: 112 sales monthly. Additional revenue: $6,400 monthly or $76,800 annually. If your net margin is 25%, that’s $19,200 additional annual profit. You can justify spending up to $19,200 on photography for a 12-month payback period.
Most sellers target 3-6 month payback periods, suggesting a $4,800-9,600 photography budget for this example. That’s significantly higher than most sellers spend, explaining why underspending on photography while overspending on PPC is so common.
Conservative assumptions prevent overspending on unproven products. Use the lower end of CVR improvement estimates (0.5%) for your calculations. A 0.5% CVR improvement on the same example generates $2,800 additional monthly revenue or $8,400 additional annual profit at 25% margins. This supports a $2,100-4,200 photography investment for 3-6 month payback.
Breaking Even on Photography Investment
Calculate your breakeven timeline based on incremental profit per conversion and photography costs.
Simple breakeven formula: Photography cost ÷ (additional monthly profit) = months to breakeven. A $1,200 photography investment generating $400 additional monthly profit breaks even in 3 months. Every month beyond that is pure profit lift.
Factor in your customer lifetime value for repeat purchase categories. Supplements, consumables, and subscription products justify higher photography investments because each converted customer generates ongoing revenue. A $50 supplement with 30% margins and 40% monthly reorder rate has much higher customer lifetime value than a one-time electronics purchase.
Opportunity cost considerations matter for established sellers. Money spent on photography isn’t available for inventory or PPC. However, improved CVR reduces your required PPC spend for the same sales volume. Better images often reduce ACoS by 15-30% by improving Quality Score and reducing required bid amounts for the same conversion volume.
Market Position and Photography Investment
Your competitive position determines appropriate photography investment levels.
Market leaders with top 3 BSR positions need premium photography to maintain position. Competitors constantly upgrade their images. Standing still means falling behind. Market leaders should invest 2-3x average photography budgets and refresh images every 12-18 months.
Market challengers attacking established competitors need photography that clearly differentiates their positioning. This often costs more than generic product shots because it requires custom props, specific scenarios, and comparison elements. Budget 50-100% premiums for challenger positioning photography.
Niche players in specialized subcategories can often succeed with focused photography budgets. Emphasize the specific use cases and customer types that mainstream competitors ignore. A left-handed kitchen gadget needs images showing left-handed usage, not generic right-handed demonstrations.
Professional vs DIY Cost Analysis
True DIY Costs Beyond Equipment
DIY Amazon product photography seems cost-effective until you calculate the total investment required for professional-quality results.
Equipment costs for basic product photography start around $2,000-3,000. Professional camera body ($800-1,200), macro lens ($400-600), lighting kit ($300-500), tripod ($150-300), backdrop system ($200-400), and editing software ($240 annually). This equipment produces amateur results without proper training and experience.
Learning curve time investment represents the largest hidden cost. Achieving professional-quality results requires 40-80 hours of practice and education. For a seller generating $30,000 monthly, that time investment costs $1,500-3,000 in opportunity cost at a $40/hour value rate.
Ongoing time requirements make DIY increasingly expensive as you scale. Each 7-image set requires 8-12 hours for experienced DIY photographers including setup, shooting, editing, and optimization. At $40/hour opportunity cost, that’s $320-480 per product in time investment. Professional photography at $400-600 becomes cost-competitive immediately.
DIY makes sense for sellers launching 10+ products monthly where equipment costs amortize quickly. For most FBA sellers launching 2-4 products annually, professional photography delivers better ROI.
Hybrid Approaches: When to Mix Professional and DIY
Smart sellers use hybrid photography strategies to optimize costs while maintaining quality.
Professional main images, DIY lifestyle shots works for experienced sellers comfortable with lifestyle photography. Main images require technical perfection for CTR optimization. Lifestyle images allow more creative flexibility and forgive minor technical flaws. Budget $200-400 for professional main image creation, then shoot lifestyle content in-house.
Professional infographics, DIY product shots suits sellers with graphic design skills but limited photography experience. Infographic creation requires design software expertise more than photography knowledge. Professional photographers often outsource infographic creation anyway. Create your product shots in-house, then hire designers for infographic production at $75-150 per graphic.
Seasonal DIY additions extend professional photography value. Hire professionals for core 7-image sets, then add seasonal lifestyle shots in-house. Holiday-themed lifestyle images don’t require technical perfection but add seasonal relevance. A kitchen gadget showing Thanksgiving prep scenarios boosts Q4 conversions without requiring full professional re-shoots.
Quality Thresholds: When DIY Fails
Certain Amazon categories and product types require professional photography regardless of budget constraints.
Reflective products (jewelry, electronics, glassware) demand professional lighting control. DIY lighting creates hotspots, unwanted reflections, and color distortion that kills conversion rates. A poorly lit smartphone case showing fingerprints and glare converts 60% worse than professional shots.
Food and consumables require food styling expertise that takes years to develop. Professional food photographers understand color temperature, texture enhancement, and appetite appeal. DIY food photography often looks unappetizing even with good equipment.
Complex assembly products need clear instructional imagery that requires planning and staging expertise. Professional photographers script complex shots and use specialized equipment for multiple angle capture. DIY instruction images often confuse buyers and increase return rates.
Hidden Costs That Destroy Photography ROI
Revision Hell: The Budget Killer
Most photography budget overruns come from excessive revision rounds, not initial pricing miscalculations.
Undefined expectations create revision cycles that double total costs. Sellers saying “make it pop” or “needs more lifestyle feel” generate $200-500 in additional charges as photographers guess at requirements. Specific feedback reduces revision rounds by 70%.
Provide exact competitor examples for every image type. Instead of “lifestyle shot,” specify “similar to [competitor] image 3 but showing product in kitchen with granite counters.” Photographers deliver accurate results faster with specific references.
Stakeholder alignment issues multiply revision costs. When multiple team members review images without coordinated feedback, photographers receive contradictory direction. Appoint one decision-maker and consolidate feedback into single revision requests.
Technical requirement misunderstandings force expensive re-shoots. Amazon’s image requirements change frequently. Verify current pixel dimensions, text limits, and background requirements before shooting begins. A single re-shoot for non-compliance costs more than hiring Amazon-specialized photographers initially.
Timeline Pressure and Rush Fees
Poor planning creates artificial urgency that increases photography costs by 25-100%.
Rush delivery premiums apply when sellers need images in under 2 weeks. Professional photographers charge 25-50% rush fees for priority scheduling. Seasonal launches require even higher premiums as photographers book up months in advance.
Inventory planning misalignment forces expensive timeline compression. Sellers who order photography after inventory arrives pay higher rates and risk stockouts during image production. Plan photography 4-6 weeks before inventory arrival to avoid timeline pressure.
Launch date inflexibility removes negotiating power with photographers. Sellers with hard launch deadlines (trade shows, seasonal windows, competitor responses) pay premium rates because photographers know you can’t delay. Build buffer time into launch planning to maintain cost negotiation power.
Post-Launch Optimization Costs
Initial photography rarely optimizes perfectly without performance data and testing.
A/B testing additional images costs $100-300 per test variant but provides data for future optimization. Test main image variations, lifestyle scenarios, and infographic approaches. Successful tests often improve CVR by additional 0.2-0.5% beyond initial photography improvements.
Seasonal image updates maintain relevance but add ongoing costs. Holiday themes, seasonal colors, and timely props keep listings fresh. Budget $200-500 annually for seasonal lifestyle image updates for products with strong seasonal sales patterns.
Competitive response requirements force periodic image refreshes. When competitors upgrade their photography, maintaining competitive parity requires updated images. Market leaders typically refresh images every 12-18 months to stay ahead of challenger brands.
Maximizing Value from Your Photography Investment
Multi-Platform Usage Rights
Smart sellers negotiate usage rights that extend photography value beyond Amazon listings.
Social media marketing rights add 20-30% value to photography investments. Instagram, Facebook, and TikTok content creation using professional product images reduces ongoing marketing costs. Negotiate social media usage rights upfront rather than paying separate licensing fees later.
Website and email marketing usage justifies higher photography investments for sellers building owned media channels. Professional product images improve website conversion rates and email click-through rates. Shopify stores using professional photography convert 40% better than sites with amateur product images.
Print marketing and trade show rights matter for sellers using traditional marketing channels. Brochures, trade show displays, and print advertising require high-resolution files that many photographers don’t provide by default. Specify print usage needs upfront to receive appropriate file formats and resolutions.
File Organization and Asset Management
Proper file management prevents costly re-shoots and enables efficient image optimization.
Standardized file naming prevents confusion and enables quick image updates. Use formats like “ProductName_MainImage_v1.jpg” and “ProductName_Lifestyle_Kitchen_v2.jpg.” Organized file systems reduce time spent searching for specific images during listing updates.
Multiple format delivery ensures compatibility across platforms and future needs. Request images in original RAW format, edited high-resolution JPEG, Amazon-optimized versions, and social media sizes. This prevents paying re-editing fees for different platform requirements.
Cloud storage and backup systems protect photography investments from data loss. Professional photographers should provide cloud storage links with organized folder structures. Back up all image files immediately upon delivery to prevent costly asset recreation.
Performance Tracking and Optimization
Track photography ROI using specific metrics that inform future investment decisions.
Conversion rate monitoring shows direct photography impact. Compare CVR for 30 days before and after image updates, controlling for external factors like seasonality and promotions. Document which image types generate the largest CVR improvements for future reference.
Click-through rate improvements demonstrate main image effectiveness. Monitor CTR changes from search results and track which main image elements drive the best performance. Use this data to optimize main images for future products.
Return rate analysis reveals whether images accurately represent products. Professional photography should reduce return rates by setting accurate expectations. If return rates increase after image updates, the photography may be overselling product benefits or misrepresenting features.
Related Reading
Related Reading
Related Reading
Related Reading
Frequently Asked Questions
How much should I budget for Amazon product photography as a percentage of product launch costs
Photography should represent 3-8% of your total product launch investment, including inventory, marketing, and operational setup costs. For a $20,000 product launch, budget $600-1,600 for photography. Higher percentages make sense for products with strong visual differentiation opportunities, while lower percentages work for commodity products competing primarily on price.
What’s the difference between $400 and $1,200 Amazon product photography packages
Budget packages ($400-600) typically include basic white background shots with minimal styling and standard infographics. Premium packages ($1,000-1,500) include extensive lifestyle scenarios, custom props, professional styling, advanced infographics, and complete market research. The price difference reflects production complexity, not just photographer hourly rates.
How long does professional Amazon product photography take from start to finish
Professional photography typically requires 2-3 weeks from initial consultation to final image delivery. This includes 3-5 days for pre-production planning, 1-2 days for shooting, and 5-7 days for post-production editing and optimization. Rush jobs can compress this to 7-10 days but cost 25-50% more.
Should I hire local photographers or use specialized Amazon photography services
Amazon-specialized photography services understand platform requirements, image optimization, and category-specific best practices that local photographers often miss. While local photographers may cost less hourly, Amazon specialists typically deliver better ROI through proper optimization and compliance. Choose local photographers only if they demonstrate extensive Amazon experience.
How do I calculate the ROI of professional product photography for my Amazon listings
Calculate ROI by measuring conversion rate improvements before and after image updates. Multiply the additional monthly sales by your profit margin, then divide photography costs by monthly profit increase to determine payback period. A $1,000 photography investment generating $400 additional monthly profit pays back in 2.5 months and delivers ongoing returns afterward.