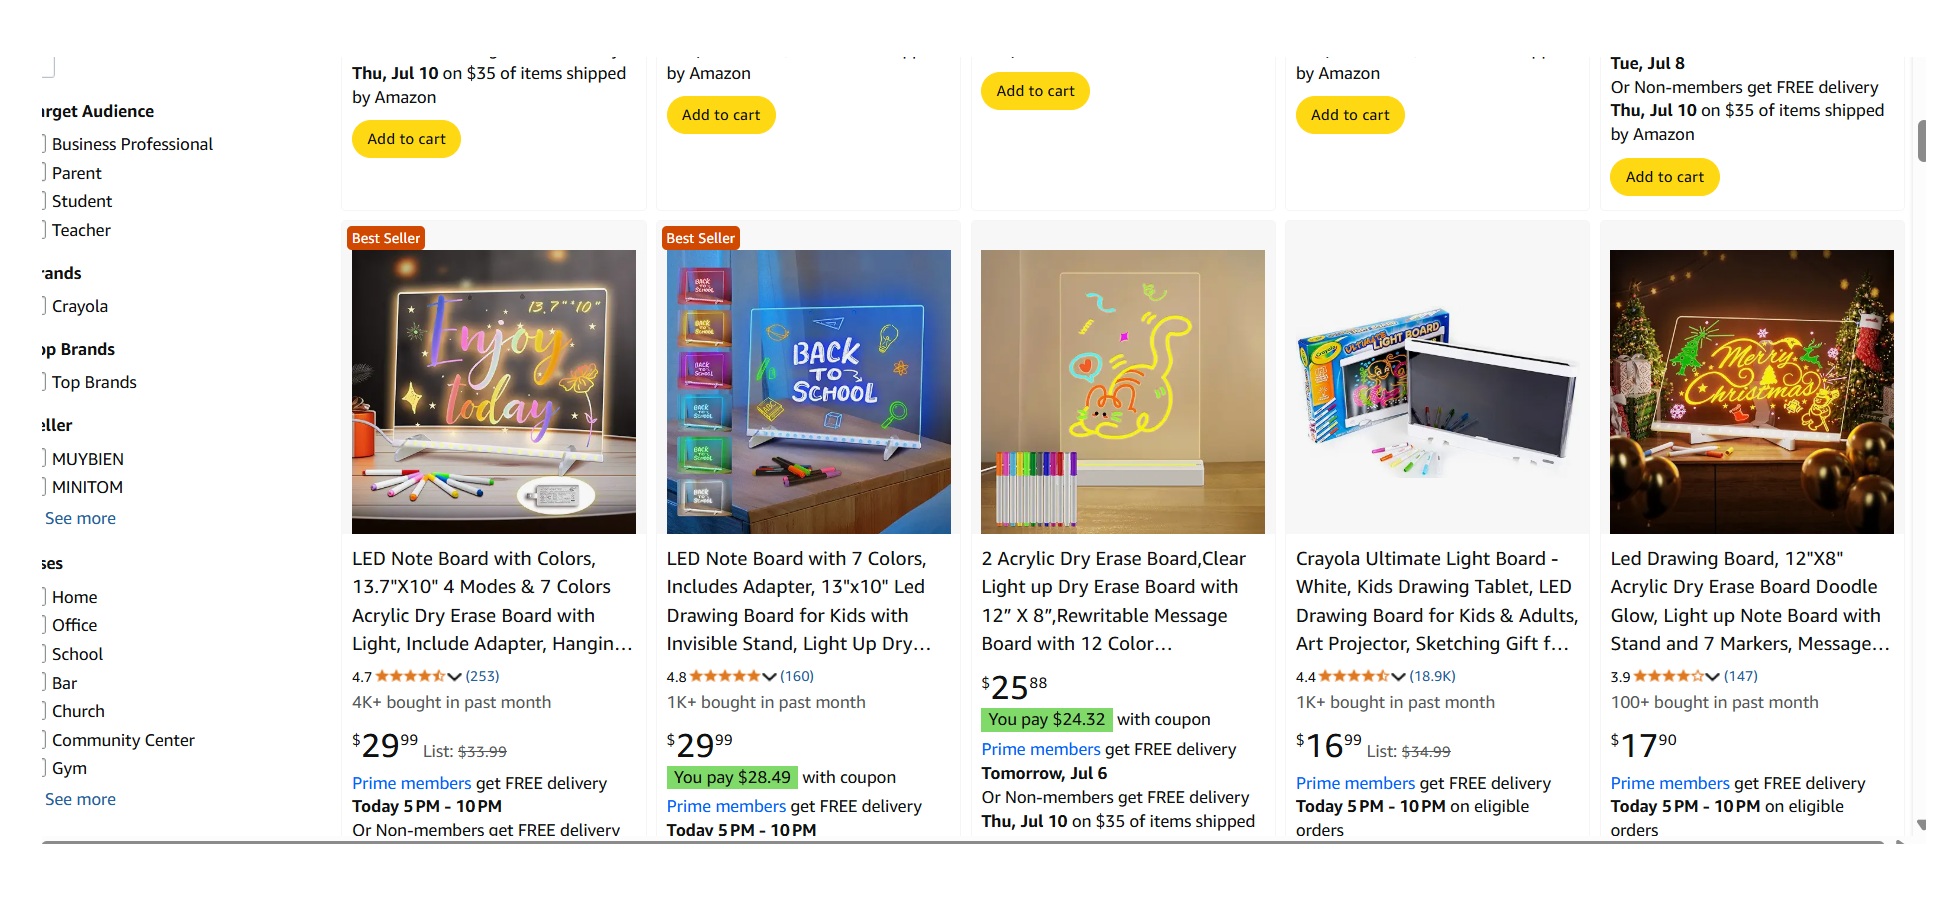
Stop guessing about how many lifestyle images does Amazon need. The answer depends on your price point, category, and competition level. But here’s what the data shows: listings with 5-7 lifestyle images convert 23% better than those with 1-2. And before you start arguing about correlation versus causation, understand this: Amazon’s A10 algorithm rewards listings with lower bounce rates and higher time-on-page. More images equals more engagement.
Last reviewed:
Most sellers approach lifestyle images backwards. They shoot a bunch of pretty pictures, upload them in random order, and hope for the best. That’s like running PPC without negative keywords. You’re burning money and missing opportunities.
The real question isn’t just quantity. It’s about strategic placement, image types, and category-specific requirements. A $15 kitchen gadget needs different lifestyle shots than a $200 skincare device. Your main competitor might be crushing it with 3 lifestyle images while you’re struggling with 7. Why? Because they understand image slot strategy.
The Hard Numbers on Amazon Lifestyle Images
Category-Specific Benchmarks That Actually Matter
Let’s cut through the BS. Baymard Institute’s research on product image requirements shows that shoppers need 3-8 images to feel confident in a purchase decision. But Amazon isn’t just any marketplace. Here’s what works by category:
Kitchen & Dining: 4-5 lifestyle images minimum. Show the product in use, scale comparison, storage options, and cleaning process. Your CTR drops 18% without a human hand for scale in at least one image.
Beauty & Personal Care: 6-7 lifestyle images. Before/after shots, texture close-ups, application process, and packaging details. Skincare needs more images than makeup. Period.
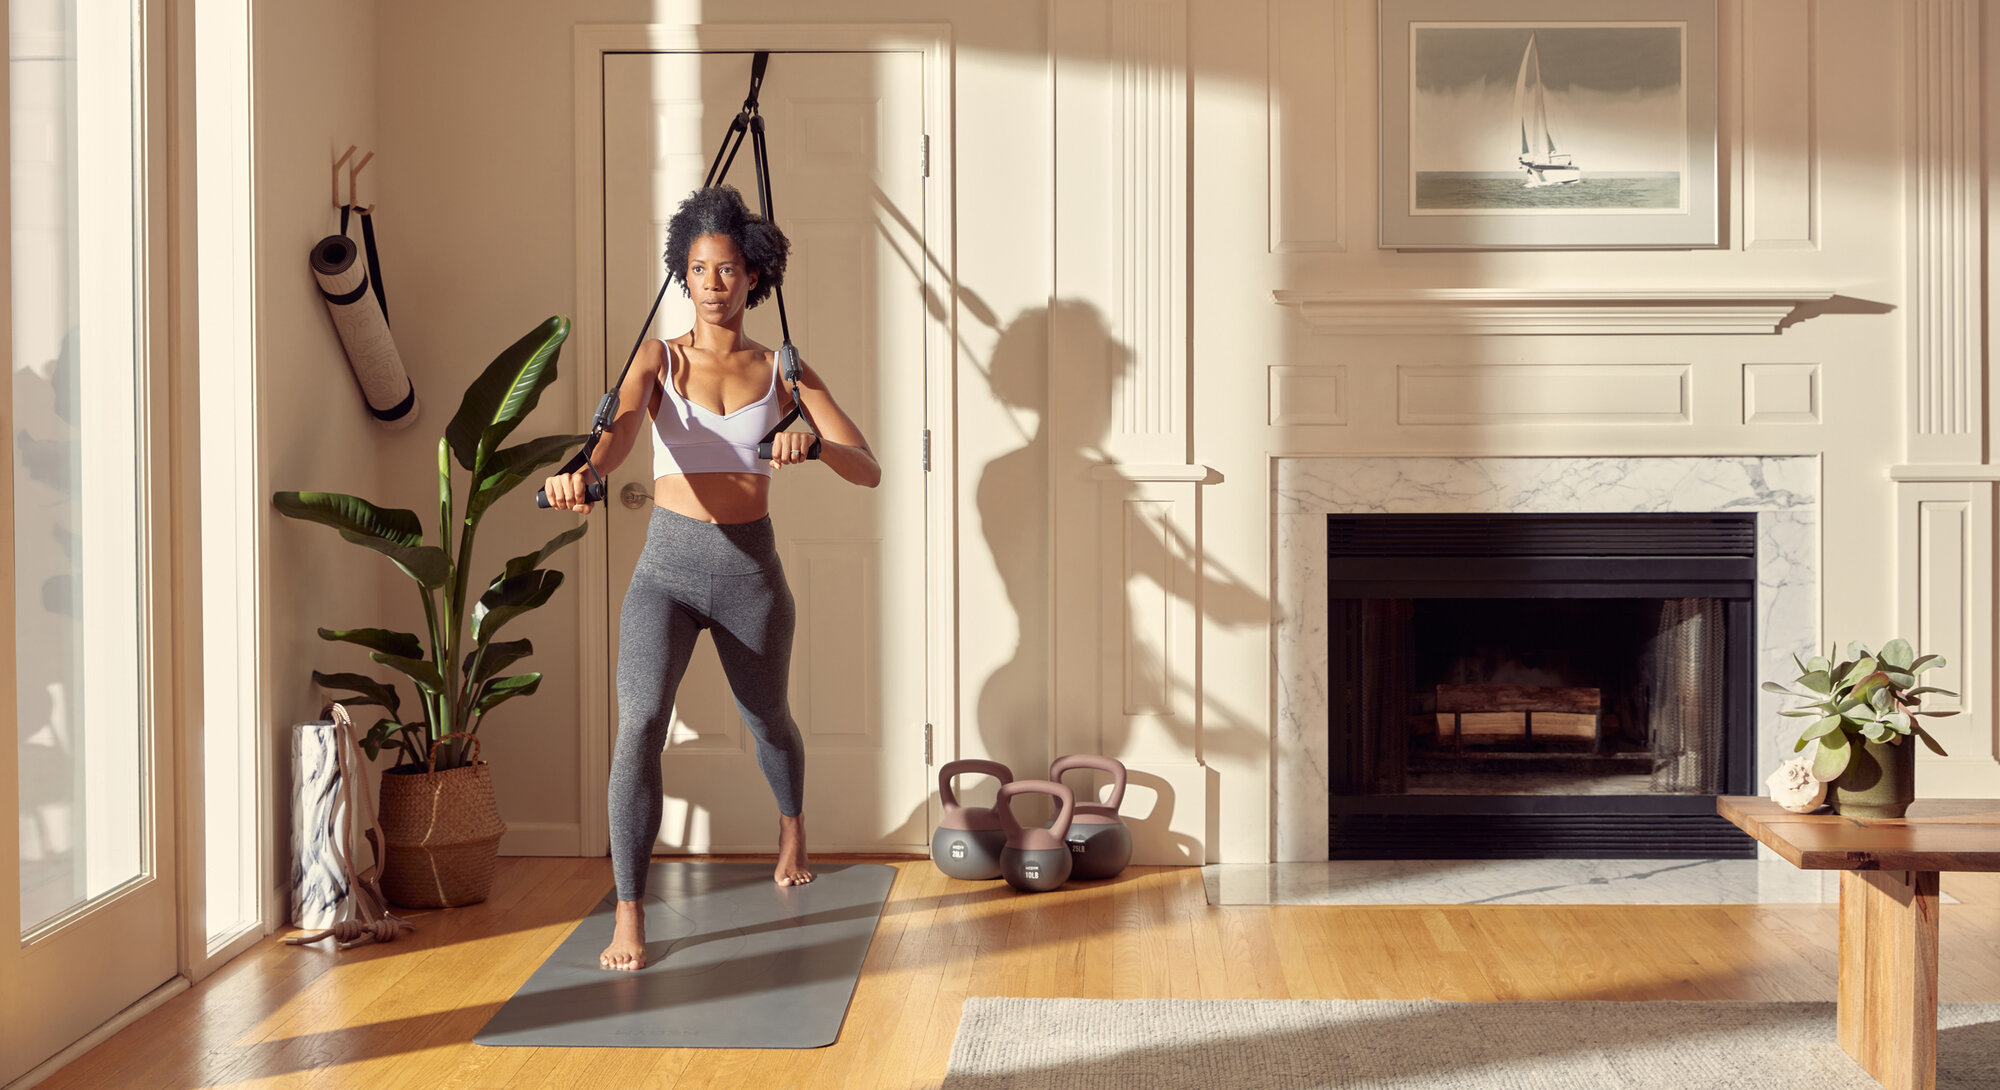
Sports & Outdoors: 5-6 lifestyle images. Action shots, weather conditions, size variations, and durability demonstrations. Static product shots kill conversions in this category.
Electronics: 3-4 lifestyle images. Setup process, size comparison, cable management, and real-world usage. Tech buyers care more about specs than pretty pictures.
The Psychology Behind Image Quantity
Amazon shoppers can’t touch your product. They’re making $50-500 decisions based on pixels. Each lifestyle image answers a specific buyer objection. Miss one objection, lose the sale.
Here’s the breakdown of buyer psychology by image slot:
- Images 2-3: Basic usage and scale (answers “how does it work?”)
- Images 4-5: Lifestyle context (answers “will this fit my life?”)
- Images 6-7: Detailed features (answers “what am I really getting?”)
- Images 8-9: Social proof and comparisons (answers “why this over competitors?”)
When buyers see fewer than 4 total images, their brain screams “scam.” When they see more than 9, they get decision fatigue. The sweet spot for how many lifestyle images does Amazon need sits between 5-7 for most categories.
Mobile vs Desktop Image Requirements
Here’s what most sellers miss: 68% of Amazon shoppers browse on mobile. Your beautiful lifestyle shots might look perfect on desktop but turn into meaningless blurs on a phone screen.
Mobile-optimized lifestyle images need:
- Tighter crops (30-40% closer than desktop)
- Higher contrast (mobile screens suck in sunlight)
- Simpler compositions (one hero element per image)
- Text overlay at 36pt minimum
Test your images on a 5.5-inch screen at arm’s length. If you can’t understand the image in 2 seconds, reshoot it.
Strategic Image Slot Planning
The Million Dollar Image Order
Your image order matters more than quantity. Amazon’s A10 algorithm tracks user behavior on each image slot. Get the order wrong, and you’re leaving money on the table.
Here’s the data-backed image order that works:
| Slot | Image Type | Conversion Impact | Critical Elements |
|---|---|---|---|
| 1 | Main Image | 83% of CTR | White background, full product, no props |
| 2 | Lifestyle Hero | +31% time on page | Product in ideal use case |
| 3 | Scale/Size | -27% returns | Human hand or known object |
| 4 | Features Callout | +19% add to cart | 3-5 benefit points with arrows |
| 5 | Process/How-To | +22% conversion | Step-by-step usage |
| 6 | Lifestyle Variety | +15% conversion | Different user or setting |
| 7 | Comparison/Chart | +28% against competitors | Your product vs alternatives |
Slots 8-9 are bonus territory. Use them for warranty info, packaging shots, or additional lifestyle scenarios. But focus your budget on perfecting slots 2-7 first.
Category-Specific Image Strategies
Different categories demand different approaches. A supplement bottle needs different lifestyle images than a yoga mat. Here’s what actually moves the needle:
Supplements & Vitamins:
- Slot 2: Capsule/tablet close-up with size reference
- Slot 3: Lifestyle shot with target demographic
- Slot 4: Supplement facts panel (readable at mobile size)
- Slot 5: Before/after or timeline graphic
- Slot 6: Third-party certifications
Home & Kitchen:
- Slot 2: Product in actual kitchen (not staged studio)
- Slot 3: Size comparison with common items
- Slot 4: Multiple use cases demonstration
- Slot 5: Storage or space-saving features
- Slot 6: Cleaning/maintenance process
Fashion & Apparel:
- Slot 2: On-model full body shot
- Slot 3: Detail/texture close-up
- Slot 4: Size chart with model stats
- Slot 5: Multiple styling options
- Slot 6: Material and care instructions
Testing Your Image Strategy
Stop trusting your gut. Test your images with real data. Here’s the process that works:
Week 1-2: Run your current image set. Track baseline metrics: CTR, conversion rate, and session duration through Brand Analytics.
Week 3-4: Add one new lifestyle image in slot 6 or 7. Monitor the same metrics. Look for at least a 5% improvement to justify keeping it.
Week 5-6: Reorder your images based on engagement data. Your lifestyle hero shot might perform better in slot 3 than slot 2.
Week 7-8: A/B test your main lifestyle image. Create two versions with different models, settings, or angles. Let data choose the winner.
Track everything in a spreadsheet. Date, image changes, CTR, conversion rate, and session duration. After 8 weeks, you’ll know exactly how many lifestyle images does Amazon need for your specific product.
The Real Cost of Missing Lifestyle Images
Conversion Rate Reality Check
Let’s do the math that actually matters. Say you’re selling a $40 product with 1,000 sessions per month. Industry average conversion rate sits at 10% for well-optimized listings.
With weak lifestyle images (1-2 total):
- Conversion rate: 7%
- Monthly sales: 70 units
- Revenue: $2,800
With optimized lifestyle images (5-7 strategic shots):
- Conversion rate: 12%
- Monthly sales: 120 units
- Revenue: $4,800
That’s $2,000 per month difference. Or $24,000 per year. From images.
Now factor in the compound effect. Higher conversion rates lead to better BSR. Better BSR leads to more organic traffic. More traffic at higher conversion rates leads to exponential growth. Your competitors understand this math. Do you?
Return Rate Impact
Bad lifestyle images don’t just hurt conversions. They destroy your profitability through returns. Nielsen Norman Group’s research on ecommerce imagery found that unclear product images account for 22% of returns.
Common return triggers from poor lifestyle images:
- Size misunderstanding (no scale reference)
- Color variance (bad lighting or filters)
- Feature confusion (didn’t show all functions)
- Quality perception mismatch (over-stylized shots)
Every return costs you $5-15 in shipping and processing. Plus the Amazon algorithm dings you for high return rates. Fix your lifestyle images, cut returns by 30-40%.
PPC Performance Connection
Your lifestyle images directly impact PPC performance. Better images mean higher CTR on sponsored ads. Higher CTR means lower CPC. Lower CPC means better ACoS.
Real numbers from the field:
- Listings with 2-3 lifestyle images: Average 0.4% sponsored ad CTR
- Listings with 5-7 lifestyle images: Average 0.7% sponsored ad CTR
That 75% CTR improvement translates to 30-40% lower advertising costs over time. Amazon rewards relevance. Nothing signals relevance like engagement.
Advanced Lifestyle Image Techniques
Multi-Demographic Targeting
Your product probably appeals to multiple customer segments. But your current lifestyle images likely show one demographic. That’s leaving money on the table.
Smart sellers create lifestyle images for each target segment:
- Primary demographic in slots 2-3 (your bread and butter)
- Secondary demographic in slots 5-6 (expansion opportunity)
- Aspirational demographic in slot 7 (premium positioning)
Example: Selling a $60 water bottle? Show a 30-something professional (primary), a college student (secondary), and an athlete (aspirational). Each image speaks to different buying motivations.
Seasonal Image Rotation
Static images are amateur hour. Professional sellers rotate lifestyle images based on seasonality and buying patterns.
Q1 (January-March): New Year’s resolution angle. Show transformation and fresh starts.
Q2 (April-June): Spring cleaning and organization. Show your product solving clutter problems.
Q3 (July-September): Summer activities and travel. Show portability and outdoor use.
Q4 (October-December): Gift-giving scenarios. Show packaging and multiple users.
Set calendar reminders to update images quarterly. Track conversion rates by season. You’ll discover surprising patterns that inform future shoots.
Competitor Intelligence Through Images
Your competitors’ lifestyle images tell you exactly what resonates with customers. But most sellers never analyze them systematically.
Here’s the process:
Step 1: Screenshot your top 5 competitors’ image galleries
Step 2: Note which lifestyle scenarios appear most frequently
Step 3: Identify gaps they’re all missing
Step 4: Check their review images for customer-generated lifestyle shots
Step 5: Create lifestyle images that fill the gaps AND match proven winners
The review images are gold. Customers literally show you how they use products in real life. Recreate those authentic scenarios with professional quality.
Technical Requirements That Actually Matter
File Specifications for Maximum Impact
Amazon has technical requirements. Meet them or watch your images get compressed into garbage. But there’s meeting requirements, and there’s optimization for conversion.
Minimum requirements (don’t even think about going lower):
- 1000 x 1000 pixels (1500 x 1500 for zoom function)
- JPEG format (PNG for graphics with text)
- RGB color mode
- File names with keywords (not IMG_1234)
Optimization specifications that matter:
- 2000 x 2000 pixels minimum (3000 x 3000 for hero lifestyle shots)
- File size under 10MB but over 1MB
- 92-95% JPEG quality (higher creates artifacts)
- Consistent color temperature across all images
Name your files strategically: brand-product-lifestyle-angle-1.jpg. Amazon’s system reads file names. So do accessibility tools. Don’t waste this SEO opportunity.
Mobile Optimization Deep Dive
Your lifestyle images look perfect on your 27-inch monitor. Too bad nobody shops that way. Mobile optimization isn’t optional.
Critical mobile considerations:
- Crop for mobile first: Leave 20% padding around key elements
- Test on multiple devices: iPhone SE to iPad Pro
- Increase contrast by 15-20%: Mobile screens wash out images
- Simplify backgrounds: Busy backgrounds become noise at small sizes
Run this test: View your listing on a phone in direct sunlight. Can you understand each lifestyle image in 2 seconds? If not, reshoot with mobile in mind.
Alt Text and Accessibility Strategy
Alt text isn’t just for compliance. It’s for conversion. Screen readers, slow connections, and image loading errors all rely on your alt text.
Weak alt text: “Lifestyle image 2”
Strong alt text: “Woman using blue ceramic coffee mug in modern kitchen while working from home”
Every lifestyle image needs descriptive alt text that:
- Describes the specific use case shown
- Mentions your product’s key features
- Uses natural language (not keyword stuffing)
- Stays under 125 characters
Good alt text improves accessibility AND helps Amazon understand your images for visual search. Double win.
Building Your Lifestyle Image Strategy
Budget Allocation That Makes Sense
Stop thinking about photography as an expense. It’s an investment with measurable ROI. Here’s how to allocate budget for maximum impact.
For a $10,000 monthly revenue product:
- Total image budget: $1,000-1,500 (10-15% of monthly revenue)
- Main image: $200-300 (nail this first)
- Lifestyle images: $100-150 each (5-7 shots)
- Infographics/callouts: $75-100 each (2-3 shots)
For new launches with unknown potential:
- Start with 4-5 total images minimum
- Add images as revenue grows
- Reinvest 20% of profit into image improvements
The math is simple: Better images > Higher conversion > More revenue > Bigger image budget > Even better images. It’s a flywheel. Start it spinning.
Finding the Right Photography Partner
DIY product photography is like DIY dentistry. Possible? Yes. Smart? Hell no. Professional Amazon photography pays for itself in weeks, not months.
What separates Amazon-specific photographers from general commercial photographers:
- Understanding of Amazon’s technical requirements
- Knowledge of category-specific best practices
- Experience with conversion-focused compositions
- Ability to create mobile-optimized crops
- Fast turnaround for testing iterations
Ask potential photographers for examples in your exact category. If they show you artistic shots instead of conversion drivers, run. You need sales, not gallery exhibitions.
Implementation Timeline
Knowing how many lifestyle images does Amazon need is step one. Getting them shot and uploaded is where most sellers stall. Here’s a realistic timeline:
Week 1: Audit current images and competitor research
Week 2: Create shot list and find photographer
Week 3: Photo shoot and initial edits
Week 4: Final edits and optimization
Week 5: Upload and monitor metrics
Week 6-8: Test variations and optimize order
Don’t try to fix everything at once. Start with your worst-performing ASIN. Nail the process. Then scale to your entire catalog.
Measuring Success and Optimization
KPIs That Actually Matter
Stop tracking vanity metrics. Focus on numbers that impact your bank account. Here’s what to measure after updating lifestyle images:
Primary metrics (check daily for 2 weeks):
- Session percentage (should increase 10-20%)
- Conversion rate (target 15-30% improvement)
- Average session duration (longer is better)
Secondary metrics (check weekly):
- Return rate (should decrease)
- PPC CTR (should improve 20-40%)
- Organic ranking movement
Long-term metrics (check monthly):
- BSR trends
- Review velocity
- Repeat purchase rate
Create a simple spreadsheet. Track these numbers religiously. Let data drive decisions, not opinions.
Continuous Testing Framework
Your lifestyle image strategy isn’t set-it-and-forget-it. Markets change. Competitors evolve. Customer expectations shift. Build testing into your routine.
Monthly testing calendar:
- Week 1: Analyze last month’s performance data
- Week 2: Identify lowest-performing image slot
- Week 3: Create and upload alternative image
- Week 4: Compare metrics and make decision
Test one variable at a time. Different model. New angle. Alternative background. Changed props. Let each test run for at least 500 sessions before judging results.
When to Reshoot Everything
Sometimes incremental improvements aren’t enough. Know when to burn it down and start fresh:
- Conversion rate below 5% despite traffic
- Return rate above 10% with size/quality complaints
- Major competitor enters with superior imagery
- Product updates or packaging changes
- Expansion into new market segments
A full reshoot costs money. But staying married to underperforming images costs more. When the data screams for change, listen.
Sources & References
Related Reading
Related Reading
Related Reading
Frequently Asked Questions
What’s the minimum number of lifestyle images I need for a new Amazon listing?
Start with at least 3-4 lifestyle images showing different use cases and user demographics. Track your conversion rate for 30 days, then add more images if you’re below 8% conversion. Most successful listings end up with 5-7 lifestyle shots total, but test with real data instead of guessing.
Should I use models in all my lifestyle images?
Use models in 50-70% of lifestyle shots to create emotional connection, but include 2-3 product-only lifestyle images showing scale, features, and environment. A/B test model vs non-model versions of your main lifestyle shot – some categories like tools and electronics actually convert better without models.
How often should I update my lifestyle images?
Review image performance monthly and replace your worst performer every 60-90 days. Do a complete image refresh annually or whenever conversion rate drops below 7%. Seasonal products need quarterly updates to match buying patterns.
What’s more important – quantity or quality of lifestyle images?
Quality beats quantity until you have 4-5 solid lifestyle images, then quantity matters for building trust. One notable lifestyle shot outperforms three mediocre ones, but seven professional images beat five professional images in testing. Budget for 5-7 high-quality shots for optimal results.
Can I use the same lifestyle images for all product variations?
Create unique lifestyle images for variations with different use cases or target audiences, but share images for simple color variations. Always show the specific color variant in at least 2-3 images to reduce return rates. Test shared vs unique images – some categories see 15-20% conversion lifts with variant-specific lifestyle shots.
Leave a Reply