Stop lying to yourself about your Amazon listing profitability. Most sellers think they’re calculating ROI correctly, but they’re missing 40% of their actual costs. That’s the difference between thinking you’re making $50,000 profit and actually losing money.
Last reviewed:
I’ve audited over 300 Amazon seller accounts. The average seller can’t tell you their true listing ROI within 20%. They track revenue. They track PPC spend. But they ignore storage fees, returns, disposal costs, and a dozen other profit killers that compound monthly.
This guide shows you exactly how to calculate Amazon listing ROI using the same framework I used to scale from $10K to $2M monthly revenue. No spreadsheet templates to buy. No courses to take. Just math that works.
Understanding True Amazon Listing Costs
Your listing costs more than you think. Way more. The average seller tracks maybe 60% of their actual expenses. That missing 40% is why profitable-looking listings suddenly become cash flow nightmares.
Direct Costs You’re Already Tracking
These are the obvious ones. The costs most sellers remember to include when they try to calculate Amazon listing ROI:
- Product cost: What you pay your supplier per unit
- Amazon referral fees: 8-45% depending on category (usually 15%)
- FBA fees: $2.70-$5.45 for standard-size items under 1 lb
- PPC spend: Your daily campaign budgets across all ad types
- Shipping to Amazon: Freight or small parcel costs to FBA warehouses
But here’s where sellers mess up. They stop there. They pull these numbers into a basic spreadsheet, subtract from revenue, and call it profit. Wrong.
Hidden Costs Killing Your Margins
These are the profit killers hiding in your Seller Central reports. Most sellers discover these only after their cash flow dries up:
- Long-term storage fees: $6.90 per cubic foot after 365 days
- Removal and disposal fees: $0.32-$0.97 per unit for unsold inventory
- Return processing fees: $5.00 per return for items over $300
- Reimbursement gaps: Amazon misses 3-5% of legitimate reimbursements
- Inventory financing costs: 12-18% APR if using loans or credit
- Photography and listing optimization: $400-2000 per SKU for professional Amazon product photography
- Software subscriptions: $200-500 monthly for essential tools
- Virtual assistant costs: $500-2000 monthly for listing management
Add these up. Suddenly that 30% margin becomes 12%. Or negative.
Opportunity Costs Nobody Calculates
This is advanced stuff, but it matters once you scale past $50K monthly. Every dollar tied up in slow-moving inventory could be generating returns elsewhere:
- Capital efficiency: Could that $10,000 in dead stock generate 25% returns in a different SKU?
- Listing slot optimization: Is this SKU worth one of your limited brand registry slots?
- Team bandwidth: Time spent managing low-ROI listings costs high-ROI opportunities
Smart sellers factor opportunity cost into their ROI calculations. That’s how you identify which listings to kill before they kill your business.
The Complete ROI Calculation Formula

Here’s the formula that actually works. Not the simplified version from YouTube gurus. The real math that determines whether you’re building wealth or burning cash.
Basic ROI Formula for Single Listings
Start with this foundation before adding complexity:
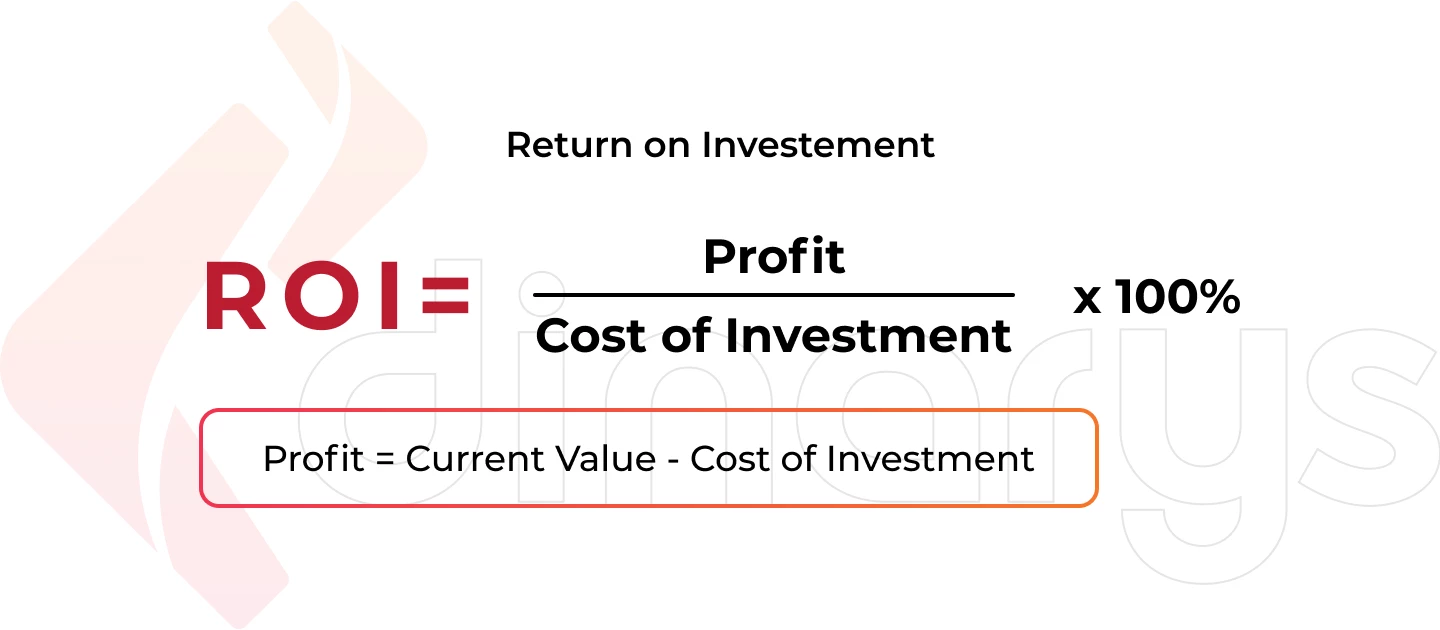
ROI = [(Total Revenue – Total Costs) / Total Investment] x 100
Sounds simple. But defining “Total Costs” and “Total Investment” is where sellers screw up. Let me break it down with real numbers:
| Cost Category | Monthly Amount | Per Unit (1000 units/month) |
|---|---|---|
| Product Cost (landed) | $5,000 | $5.00 |
| Amazon Fees (15% + FBA) | $4,500 | $4.50 |
| PPC Spend (25% ACoS) | $3,750 | $3.75 |
| Storage Fees | $200 | $0.20 |
| Returns/Refunds (5%) | $750 | $0.75 |
| Photography (amortized) | $67 | $0.07 |
| Software/Tools | $300 | $0.30 |
| Total Costs | $14,567 | $14.57 |
If you’re selling at $30 per unit, that’s $30,000 revenue. Your profit is $15,433. Your ROI on the $14,567 investment is 106%.
But wait. That’s monthly ROI. Annual ROI factors in inventory turns, seasonal fluctuations, and capital tied up in stock.
Advanced Multi-Variable ROI Tracking
Once you understand basic ROI, add these variables for accuracy:
1. Time-Weighted ROI
Money has time value. A listing that takes 6 months to generate 50% ROI is worse than one generating 40% in 2 months.
2. Risk-Adjusted ROI
High-competition niches need higher ROI targets. If there’s a 30% chance of listing suppression or price wars, your ROI needs a buffer.
3. Velocity-Based ROI
Fast-moving inventory generates compound returns. Include inventory turnover rate in your calculations:
Velocity-Adjusted ROI = Base ROI x (Annual Inventory Turns / 12)
ROI Benchmarks by Category
Stop comparing your supplements ROI to someone selling kitchen gadgets. Different categories have different economics. Based on Statista’s Amazon marketplace data, here are realistic ROI targets:
- Supplements: 80-120% (high margins, high competition)
- Electronics: 25-40% (low margins, high volume)
- Beauty: 60-90% (moderate margins, brand-dependent)
- Kitchen: 40-70% (stable demand, moderate competition)
- Toys: 100-200% (seasonal spikes, inventory risk)
Anything below these benchmarks means you’re leaving money on the table. Or losing it.
Building Your ROI Tracking System
Theory is worthless without execution. You need a system that updates daily and catches problems before they compound. Here’s exactly how to build one.
Essential Metrics to Monitor Daily
Your ROI tracking system needs these data points updated every 24 hours:
- Units sold: Pull from business reports, not the dashboard
- Revenue: Gross sales minus refunds and Amazon fees
- PPC spend: Total across all campaigns, including auto
- Conversion rate: Sessions to orders, not page views
- Return rate: Track by reason code to spot quality issues
- Inventory levels: Days of stock remaining at current velocity
- Buy Box percentage: Lost Buy Box = lost ROI
Miss any of these for 3 days and you’re flying blind. I’ve seen sellers burn through $50K because they stopped checking PPC spend during a vacation.
Automated Calculation Tools
Forget manual spreadsheets. They’re error-prone and time-consuming. Use these tools to automate your ROI tracking:
For Basic Tracking:
- Google Sheets with Amazon API integration via Zapier
- Seller Central’s profit dashboard (incomplete but free)
- Basic inventory management software with P&L features
For Advanced Analysis:
- Custom SQL queries on downloaded reports
- Python scripts for multi-ASIN portfolio analysis
- PowerBI or Tableau for visual ROI trending
The tool doesn’t matter. Consistency does. Pick one system and use it religiously.
Weekly ROI Review Process
Every Sunday, spend 2 hours on this ROI review process. It’s saved my ass more times than I can count:
1. Pull your numbers (30 minutes)
- Download all Seller Central reports for the week
- Update your tracking system with fresh data
- Flag any metrics outside normal ranges
2. Calculate listing-level ROI (45 minutes)
- Run ROI formula for each active ASIN
- Compare to previous week and month
- Identify bottom 20% performers
3. Diagnose problems (30 minutes)
- Why did ROI drop? PPC creep? Return spike?
- Which costs increased unexpectedly?
- Are competitors affecting your metrics?
4. Plan corrections (15 minutes)
- List specific actions to improve ROI
- Set deadlines for implementation
- Schedule follow-up measurement
This process catches problems while they’re small. Skip it and you’ll discover issues only after they’ve cost you thousands.
Using ROI Data to Optimize Listings
ROI calculation is worthless if you don’t act on the data. Here’s how to turn numbers into profit-generating decisions.
Image Investment ROI Analysis
Your main image drives 75% of your click-through rate. But most sellers guess at image ROI instead of measuring it. Here’s the math:
Let’s say your current CTR is 0.5% and conversion rate is 10%. You get 10,000 impressions daily.
- Current sales: 10,000 x 0.005 x 0.10 = 5 units/day
- At $30 ASP with $15 profit margin = $75 daily profit
Professional images that follow Amazon’s image requirements typically improve CTR by 40-60%. Let’s use 50%:
For more on this, see our increase amazon sales guide.
- New sales: 10,000 x 0.0075 x 0.10 = 7.5 units/day
- New daily profit = $112.50
- Profit increase = $37.50/day or $1,125/month
If professional photography costs $400-600, you’re profitable in 2 weeks. That’s a 2,250% annual ROI. Yet sellers skip it to “save money.”
PPC Spend Optimization
Most sellers set PPC budgets based on feel. Wrong approach. Use ROI data to optimize spend mathematically:
The PPC ROI Formula:
PPC ROI = [(PPC Revenue – PPC Spend – Product Costs) / PPC Spend] x 100
But here’s what matters: marginal ROI. As you increase PPC spend, ROI typically decreases. Find the sweet spot:
- Calculate ROI at different spend levels (use 2-week tests)
- Plot the curve of spend vs. ROI
- Find where ROI drops below your minimum threshold
- Set budgets just below that point
Example from a real supplement listing:
- $50/day spend: 150% ROI
- $100/day spend: 110% ROI
- $150/day spend: 75% ROI
- $200/day spend: 45% ROI
Optimal spend: $100-125/day. Beyond that, you’re burning money for vanity metrics.
Pricing Strategy Based on ROI Targets
Stop pricing based on competitors. Price based on ROI targets. Here’s the framework:
1. Set your minimum acceptable ROI (usually 50-100% for established listings)
2. Calculate your true cost per unit including all hidden costs mentioned earlier
3. Work backwards from ROI target:
Required Price = Total Costs x (1 + Target ROI)
4. Test price elasticity in 5% increments:
- Raise price 5%, measure unit velocity change
- If velocity drops less than 5%, your ROI increases
- Keep testing until velocity drop exceeds price increase
Most sellers underprice by 15-20%. They think lower prices mean more sales. But proper pricing often improves both revenue AND profitability.
Common ROI Calculation Mistakes

After reviewing hundreds of seller spreadsheets, these are the mistakes that cost the most money.
Ignoring Return Rates in Calculations
Returns kill ROI faster than high ACoS. Yet most sellers treat them as “part of doing business” instead of a metric to optimize.
Real example from a beauty brand:
- Gross sales: $100,000/month
- Return rate: 12%
- Cost per return: $8.50 (FBA return processing + lost product)
- Monthly return cost: $12,000 in returns x $8.50 = $1,020
But that’s not all. Returns also:
- Hurt your listing’s conversion rate metrics
- Increase negative review probability by 3x
- Create inventory planning nightmares
- Trigger Amazon account health warnings above 10%
Include a “return impact multiplier” of 1.5x in your ROI calculations. A 10% return rate doesn’t just cost you 10% of revenue — it costs 15% when you factor in secondary effects.
Miscalculating Storage Fee Impact
Amazon storage fees compound in ways that surprise even experienced sellers. The mistake: calculating storage fees based on current inventory levels instead of average levels.
Here’s what actually happens:
- You order 3 months of inventory to get better unit pricing
- Sales velocity varies 20-30% month to month
- Excess inventory accumulates during slow periods
- Storage fees spike during Q4 (October-December)
Accurate storage fee calculation:
Monthly Storage Cost = (Average Daily Units x Cubic Feet per Unit x Monthly Rate x Days in Storage) / 30
Pro tip: Calculate storage fees as a percentage of product cost. If it exceeds 5%, you’re over-ordering.
Forgetting Opportunity Cost
This is the silent killer for growing sellers. Every dollar tied up in Listing A can’t be invested in Listing B.
Example with real numbers:
- Listing A: $50K inventory, 60% annual ROI, 4 inventory turns
- Listing B: $50K inventory, 90% annual ROI, 6 inventory turns
Keeping Listing A costs you $15K in annual profit. That’s the opportunity cost most sellers never calculate.
Include opportunity cost by using this adjusted ROI formula:
Adjusted ROI = Actual ROI – Best Alternative ROI
If your best performing listing generates 120% ROI, every other listing needs to beat that or justify its existence through other metrics (brand building, loss leader for PPC, etc.).
Scaling Decisions Based on ROI Analysis
ROI data should drive every scaling decision. Not ego. Not revenue goals. Pure profitability math.
When to Expand vs. Optimize
The biggest mistake sellers make: launching new products when existing ones aren’t optimized. Here’s when to expand vs. double down:
Optimize existing listings when:
- Any listing has ROI below 80% of your portfolio average
- Main image CTR is below 1%
- Conversion rate is below category average (check Baymard’s e-commerce benchmarks)
- You haven’t updated images in 6+ months
- PPC ACoS exceeds 40% for any major campaign
Expand to new products when:
- All existing listings exceed ROI targets for 3+ months
- You have $50K+ in working capital above inventory needs
- Your team has bandwidth without sacrificing quality
- Market research shows clear opportunity with similar economics
The math is clear: a 20% improvement on a $100K/month listing beats launching a new $20K/month listing every time.
Investment Priorities by ROI Potential
Rank every potential investment by ROI impact. Here’s the hierarchy that works:
- Main image optimization – 200-500% typical ROI
- PPC campaign restructuring – 100-300% ROI
- Listing copy optimization – 50-150% ROI
- Secondary images upgrade – 50-100% ROI
- A+ Content creation – 30-80% ROI
- Video content – 20-60% ROI
- Brand Store development – 10-40% ROI
Notice what’s first? Images. Yet sellers spend thousands on software before investing $400 in professional photography. Bad math.
Killing Underperformers Systematically
Ego kills more Amazon businesses than competition. You must kill underperforming listings before they kill your cash flow.
The systematic approach:
1. Set clear ROI minimums:
- New listings (0-6 months): 50% minimum
- Mature listings (6+ months): 80% minimum
- Holiday/seasonal items: 100% minimum
2. Create a watch list:
- Any listing below minimums goes on 30-day probation
- Document specific improvement actions
- Set measurable success criteria
3. Execute improvements fast:
- Week 1: Image and title optimization
- Week 2: PPC restructuring
- Week 3: Pricing tests
- Week 4: Measure and decide
4. Kill without emotion:
- Liquidate through deals and coupons
- Remove inventory before long-term storage fees
- Reallocate capital to proven winners
I’ve killed listings that generated $500K in annual revenue because the ROI sucked. Revenue is vanity. ROI is sanity.
Sources & References
Related Reading
- The Ultimate Amazon Listing Optimization Checklist: 47 Points That…
- How Your Amazon Listing Images Control Your PPC Performance: The…
- Amazon Listing Suppression: 17 Hidden Triggers and How to Fix Each One
Frequently Asked Questions
What’s a good ROI percentage for Amazon FBA listings?
Aim for 80-120% annual ROI for established listings in stable categories. New listings should hit 50% within 6 months or you’re better off killing them and reallocating capital. High-risk categories like supplements or electronics need 100%+ to justify the volatility.
Should I include salary costs when calculating listing ROI?
Yes, but allocate proportionally. If you spend 10 hours weekly on a listing and value your time at $50/hour, that’s $2,000 monthly in labor costs. Divide by the number of active listings to get per-ASIN labor cost. Most sellers skip this and wonder why they’re working 60-hour weeks for minimum wage.
How often should I recalculate my listing ROI?
Weekly for your top 20% of listings, monthly for everything else. Set up automated reporting so calculation takes 30 minutes max. Any listing showing 2 consecutive weeks of declining ROI needs immediate attention before the problem compounds.
What ROI impact can I expect from professional product photography?
Professional photography typically improves click-through rates by 40-60% and conversion rates by 20-30%. On a listing doing $10K monthly with 15% margins, that translates to $3,000-4,500 in additional monthly profit. The math makes $400-600 photography investment a no-brainer with 500-1000% ROI.
How do I calculate ROI for seasonal products with irregular sales patterns?
Use rolling 12-month calculations instead of monthly snapshots. Factor in carrying costs for off-season inventory — typically 25-30% annually including storage, capital cost, and risk. Seasonal items need 50% higher ROI targets than evergreen products to justify the dead capital periods.